Remember when owning a condo that you bought in 2007 was as unfashionable as white pants after labor day. Well that seems like a distant memory in the Ukrainian Village, Wicker Park, Bucktown and the other West Town Neighborhoods of Chicago. Having witnessed the rise, fall, and now resurgence of these neighborhoods, I can tell you it's a fascinating story of the coming of age of the Gen X and Millennial Generations.
So, what's really going on here? The great oracle in the real estate bitstream, Redfin, has named Ukrainian Village "The Hottest Neighborhood In America" in 2016. Is this really true? Lets take a look at the data, behind the marketing hype.
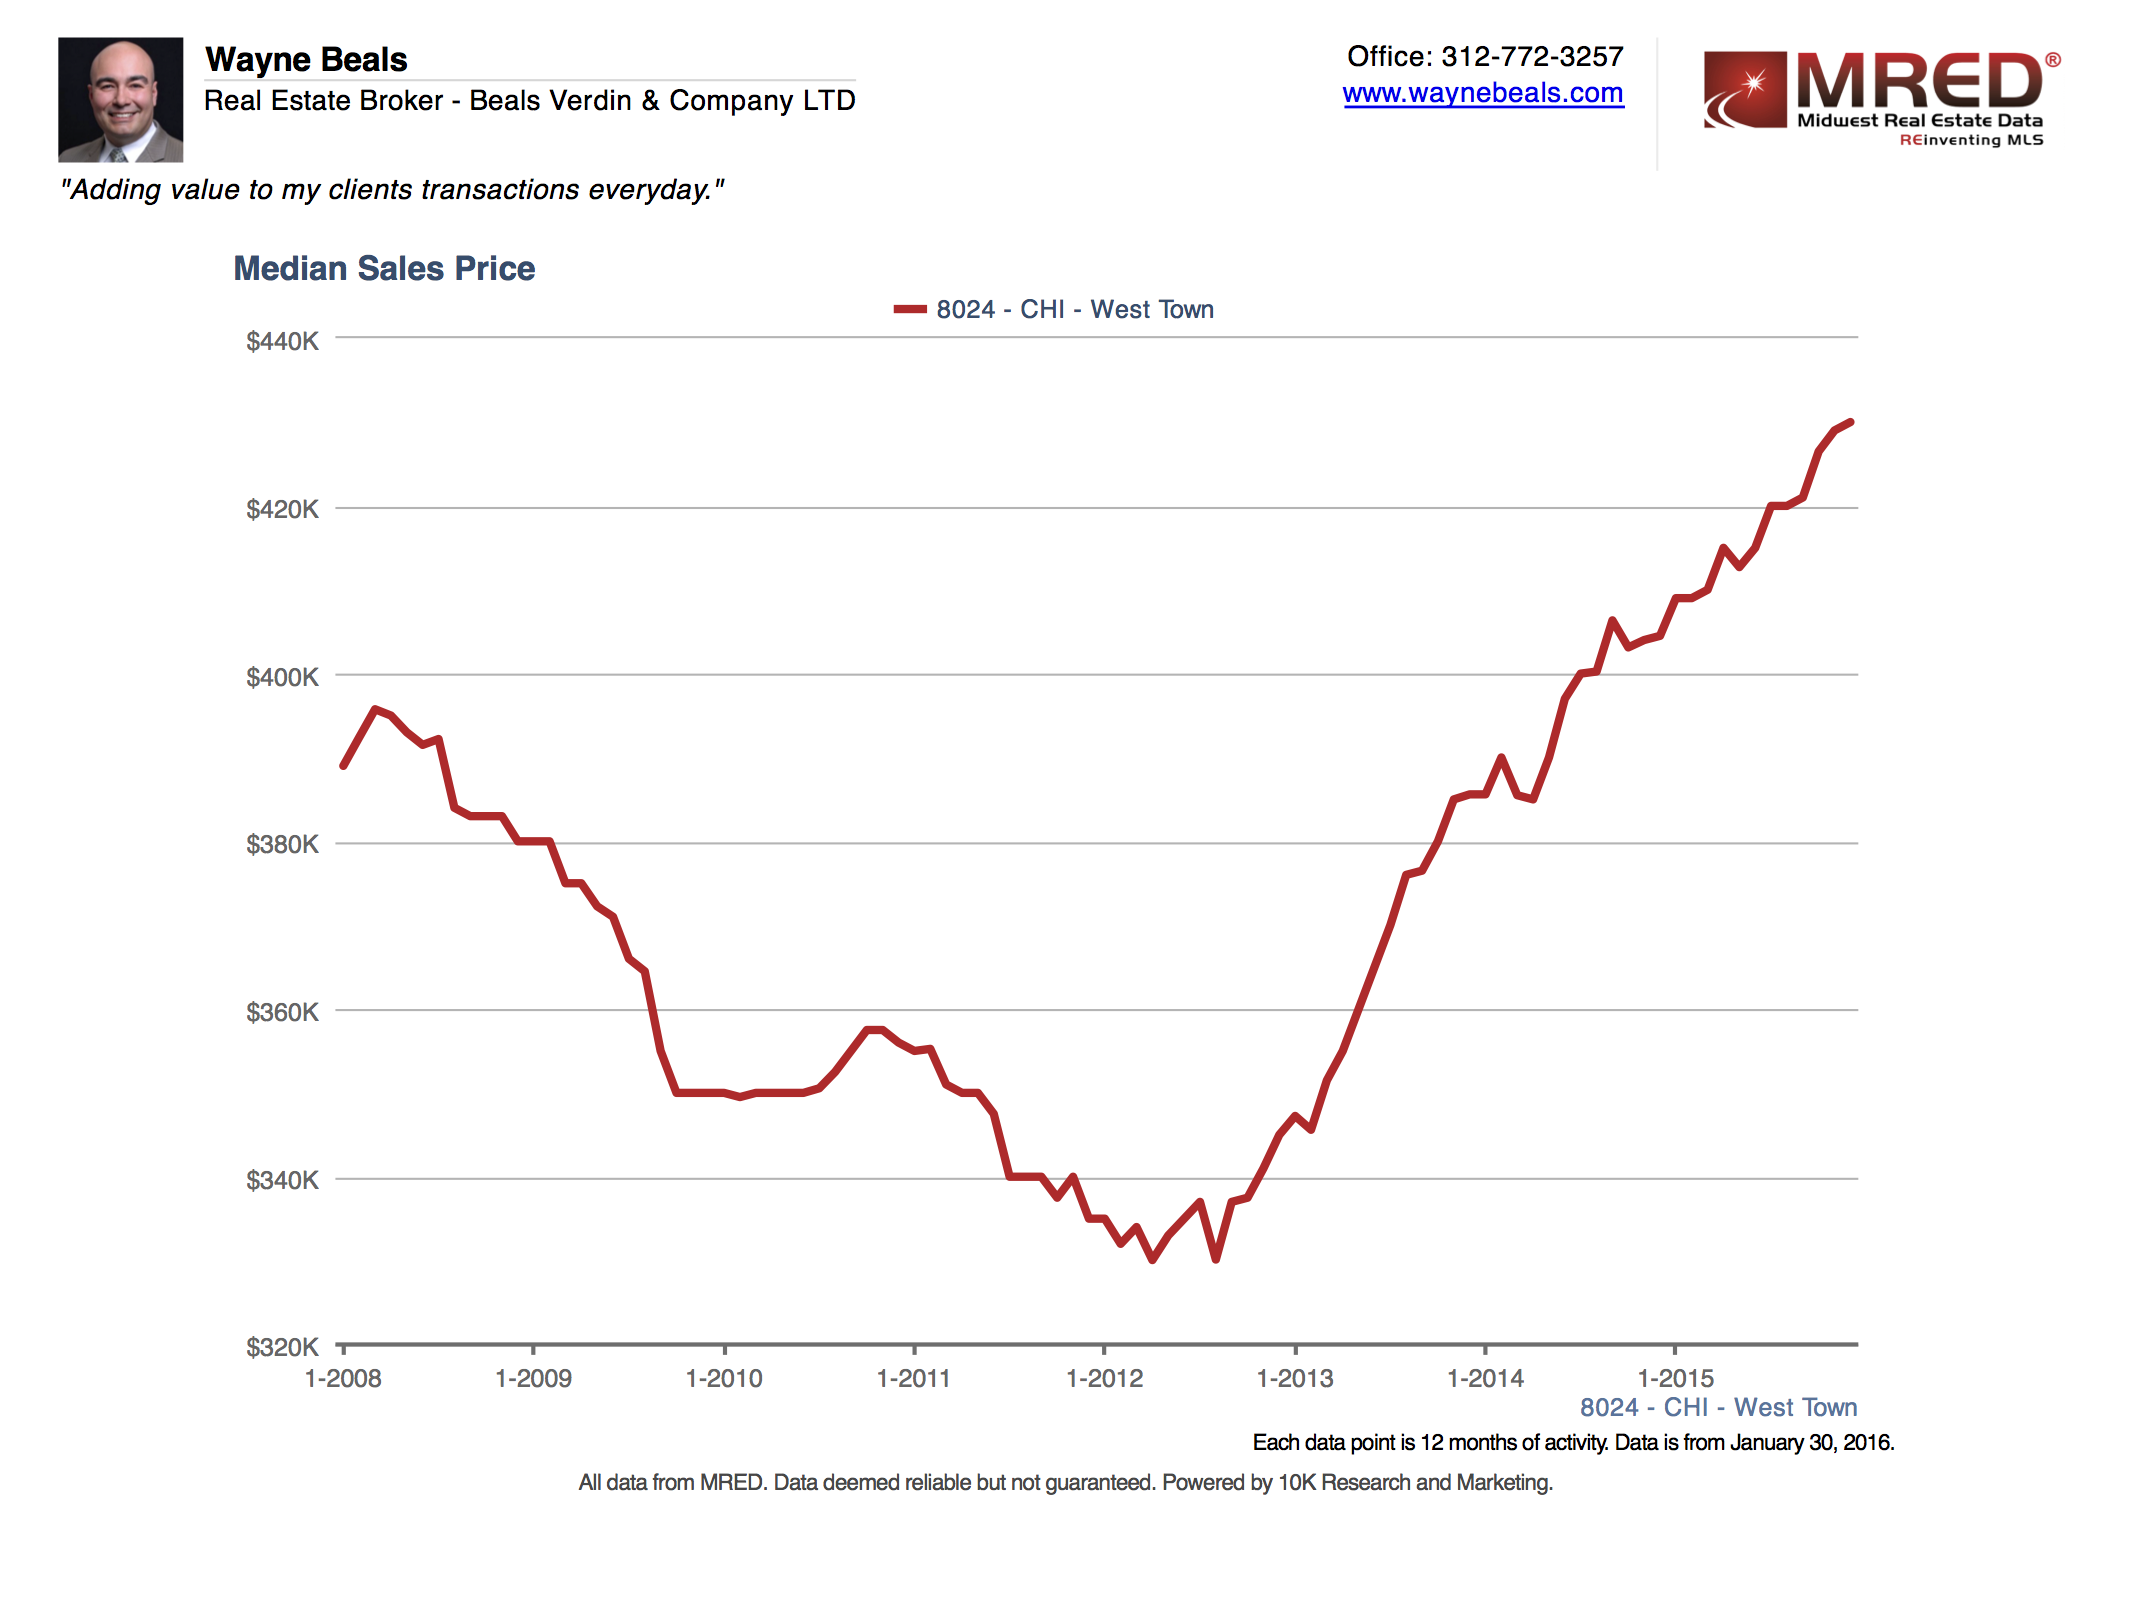
The accepted metric for price trends in the real estate industry is Median Sale Price. For this purposes of this analysis, we're going to keep it general and look at data for all residential properties sold since the peak in March of 2008 in Westown, which is comprised of Ukrainian Village, Wicker Park, as well as segments of Bucktown, Logan Square and Humboldt Park.

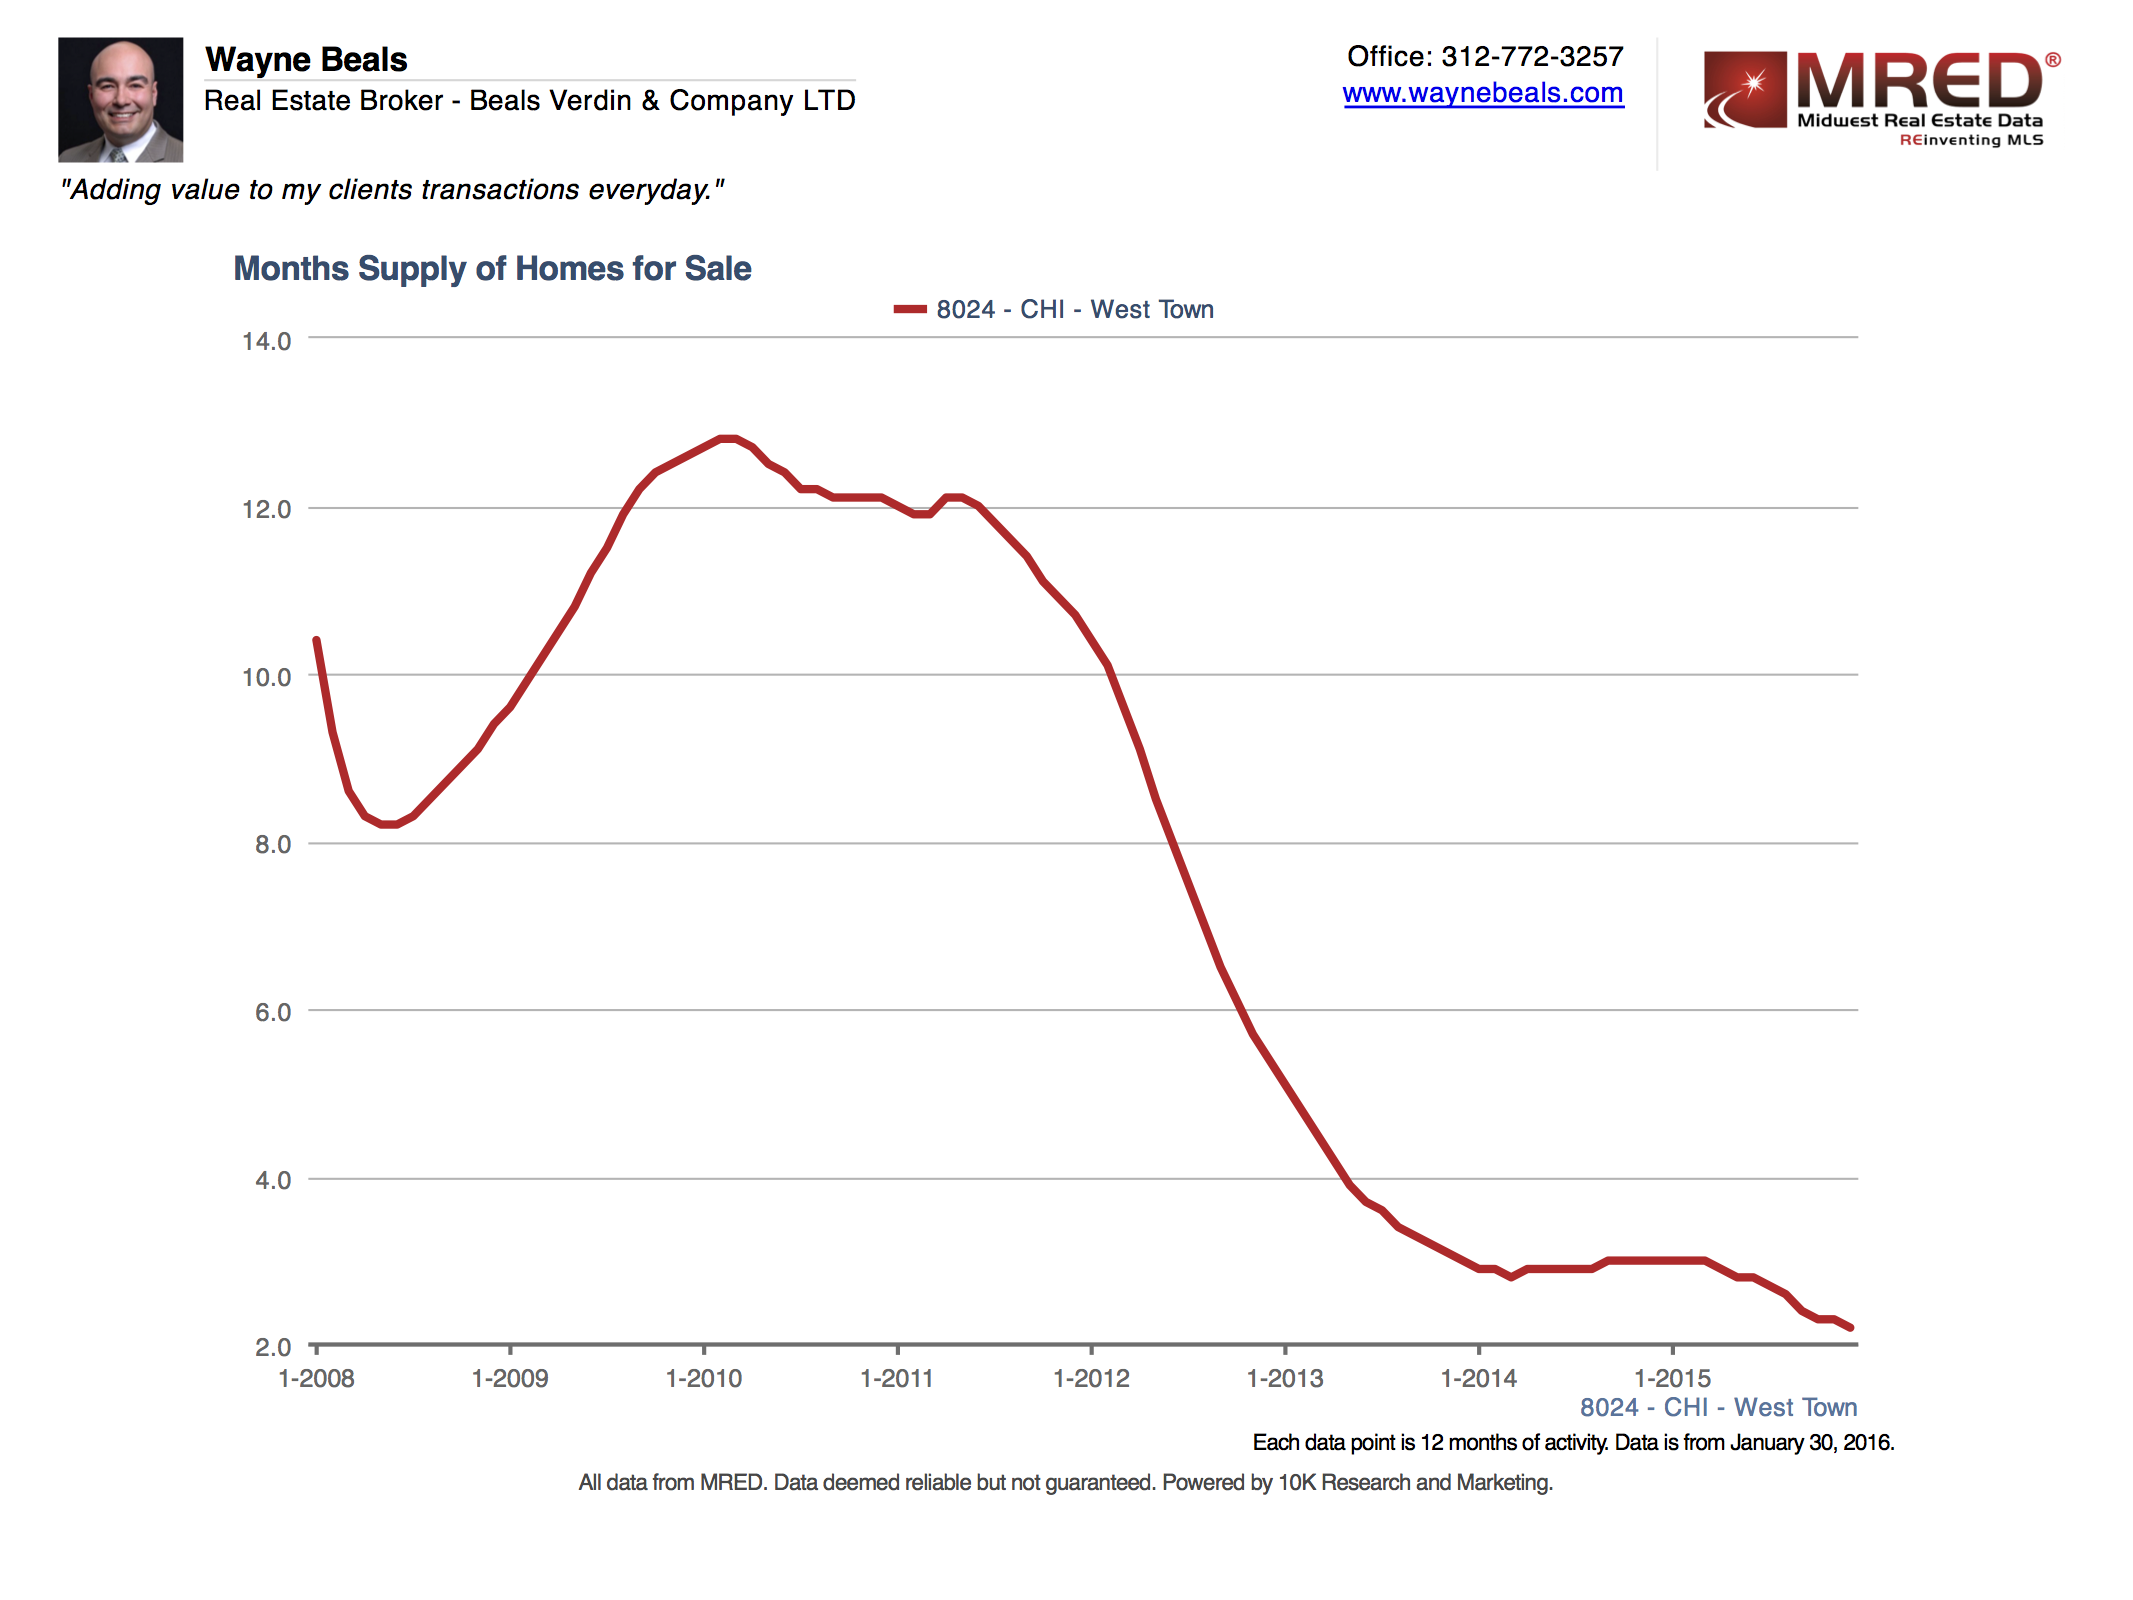
As of June 2014, the median price in West Town returned to the peak values. Since then, the numbers have been climbing, and there's very little evidence that these numbers are slowing. Since we can't tell the future, we'll look to leading indicators to help us understand how the market is shaping up for 2016. One of the strongest indicators of how the market is shaping up is Months Supply. Months Supply tells us how quickly the existing inventory of homes is being absorbed at the current rate. 3-6 months of supply is generally regarded as a balance market, and an value below 3 months of supply indicates that the sellers have the upper hand and multiple offers are more likely. Competition induces buyers in many cases to offer more than asking to gain advantage over other buyers when supply is limited.

By the end of 2007, Months Supply had climbed to unsustainably high levels. In January 2008, Months Supply had reached 10.4 months, well above balanced market levels. This was caused by a sustained boom in construction and tightening lending standards, which reduced absorption. In short, developers looking at data, speculated that the units they built would be quickly sold and at the very same moment, Wall Street had decided that risky mortgages were no longer worth absorbing into the bond market. Demand collapsed and the market went into free-fall. Month's Supply peaked in February 2010, at 12.8 months of supply, with prices bottoming soon after in 2012. Since August of 2012 prices have been in rapid recovery. The current Months Supply is at 2.2 months, well into Seller's Market territory.
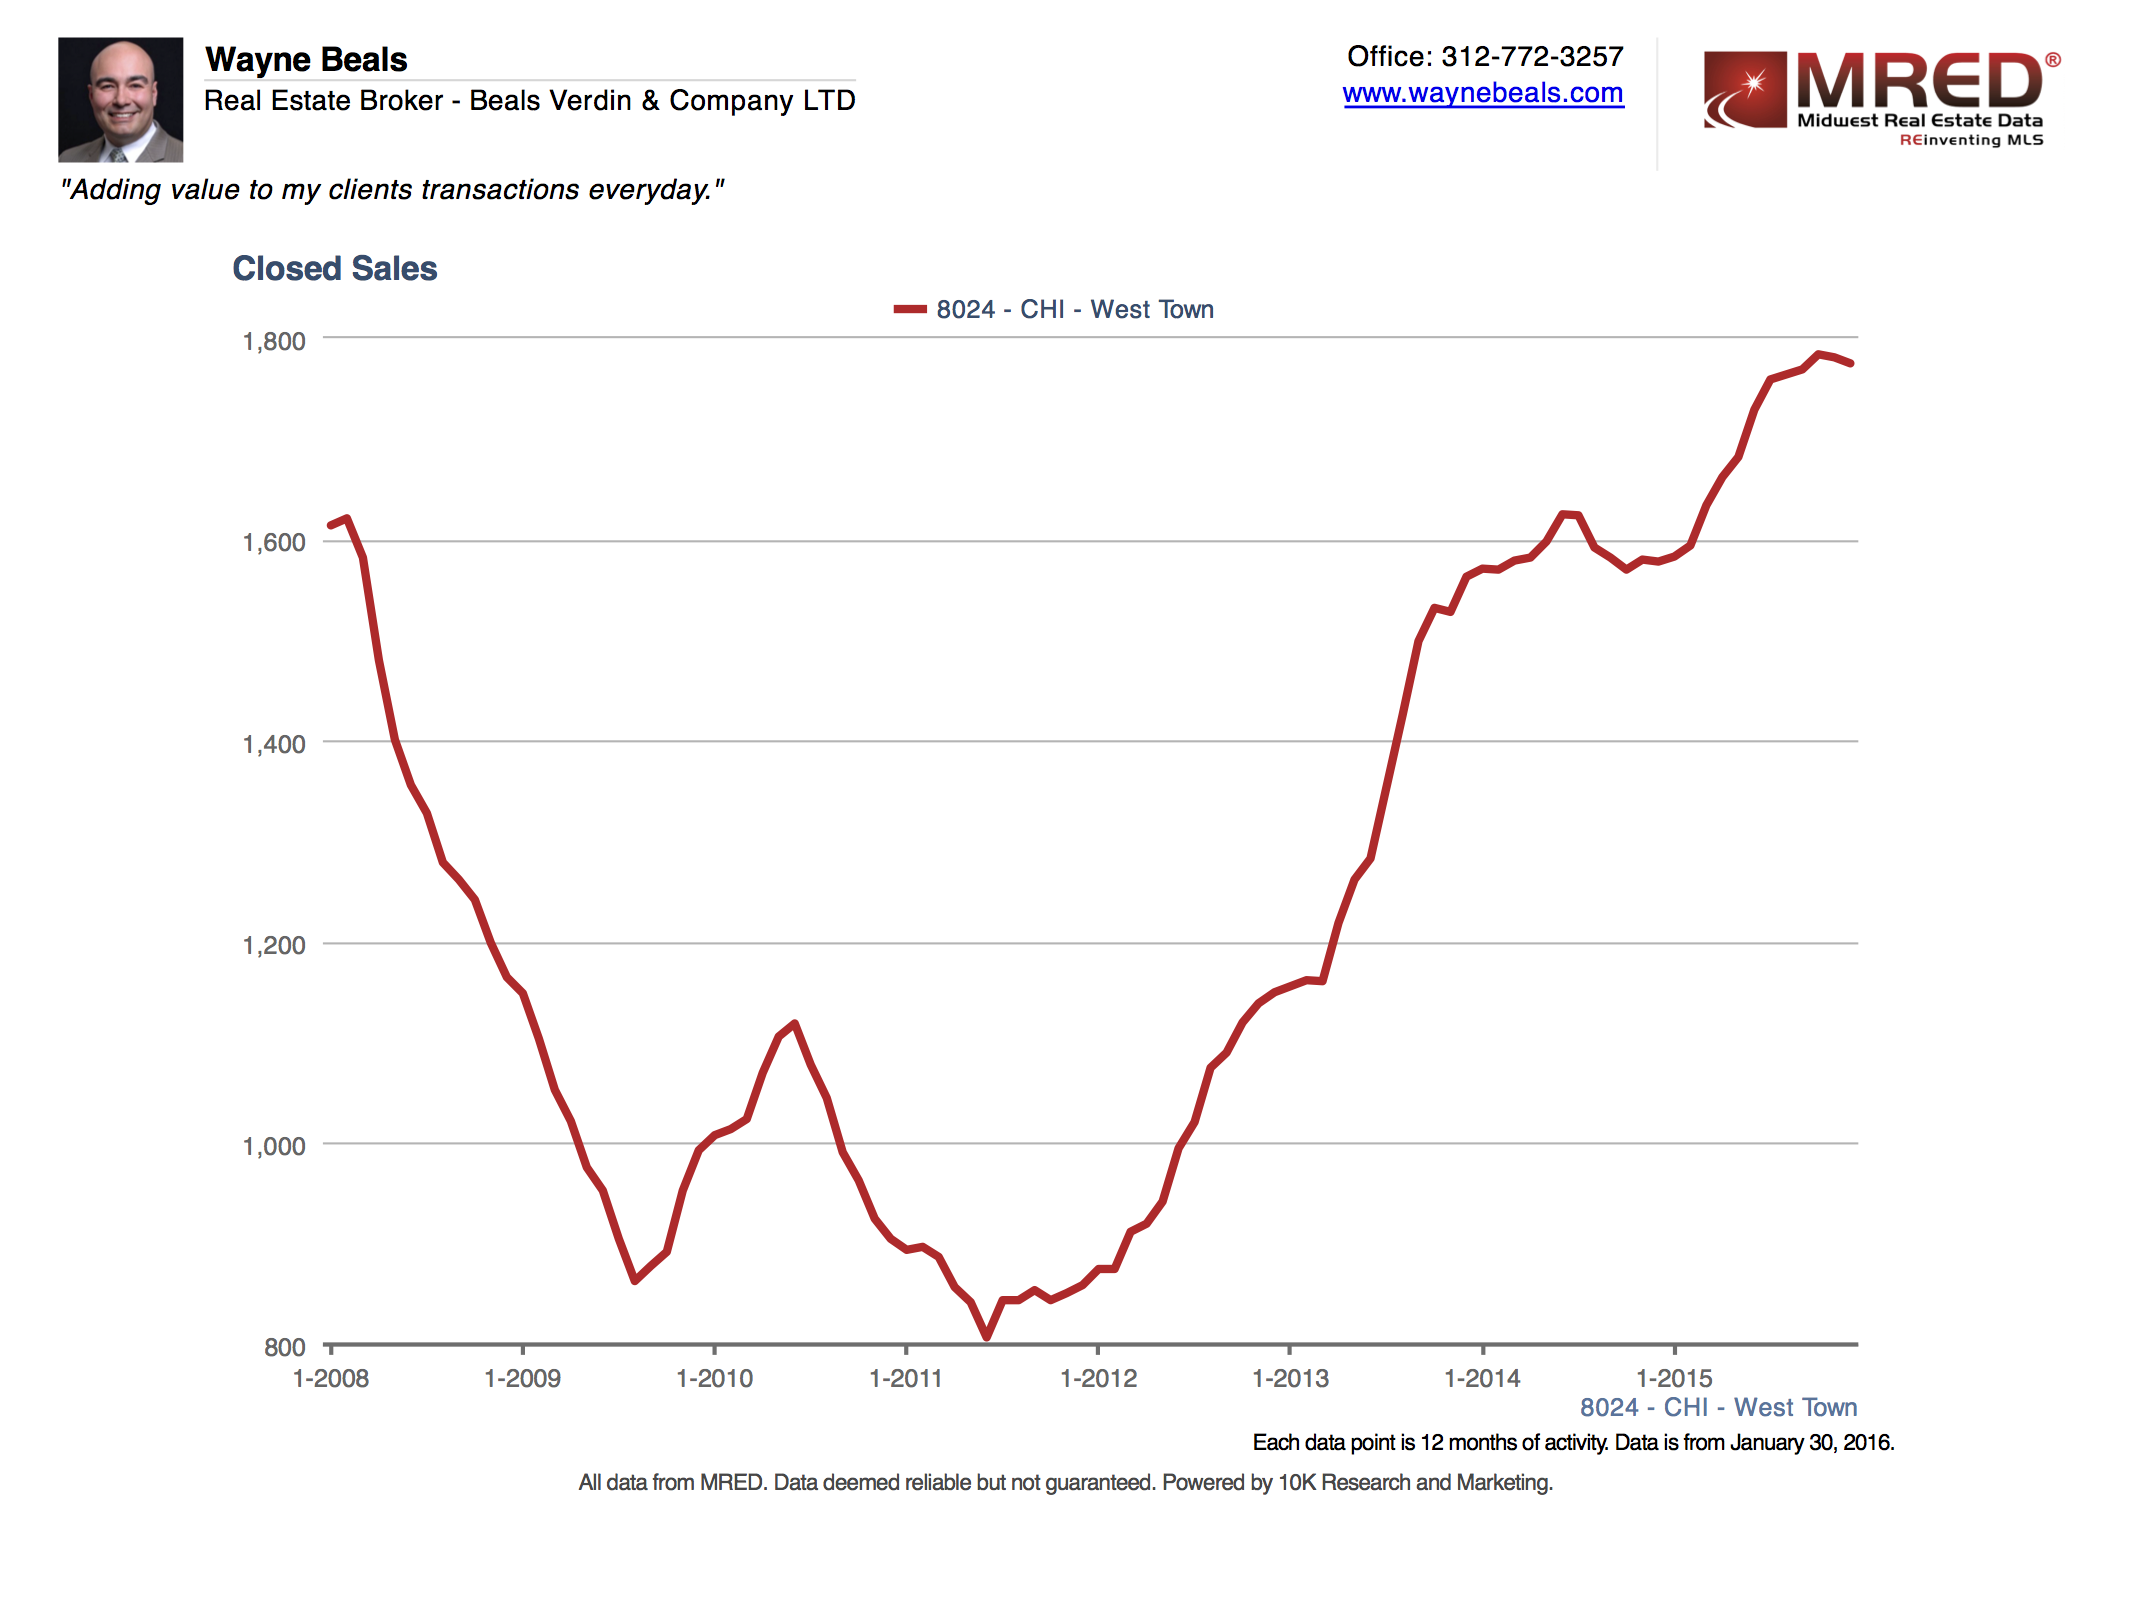
So what's diving the higher prices and lower inventory? Are there more buyers? Are sellers selling? What's really going on and is this growth sustainable? All great questions and we can look to another data set to give us insight. Closed Sales is an indicator of the volume of units sold. Let's take a look.

Very quickly, we can see that the volume of sales in December of 2015, 1775 per year, has increased dramatically over the past 3 years and is actually higher than the previous peak at of 1621 per year in February 2008. This increase in volume is happening at the same time that new construction levels are far lower than the previous peak. A perfect storm of sorts, record volume and demand, low inventory and construction have collided to constrain supply, just as demand has increased. So to answer the questions above, higher prices are being paid, because opportunities to own are limited. Seller's are selling, in record numbers. Resales accounted for 1551 of the 1775 (87.3%) of sales in 2015. As to the last question, is the growth sustainable, we have to look at the factors contributing to demand.
The first thing you have to understand about housing demand is that everyone needs a place to live. Housing is housing, whether for sale or for rent. During the recession, would be sellers choose to rent their homes. Becoming a landlord was the best option, as it allowed them to purchase a move up home and take advantage of lower prices. They could also rent their old home at a price that could sustain the mortgage. As the market has improved, these "incidental landlords" decided to sell as they could now recover their investment. Once a unit that was rented sold, the rental market lost a unit of inventory, decreasing supply. This is happening at the exact moment that Millennials are forming housing units, and looking for rental property in areas with vibrant culture and nightlife with economic access to areas of employment, like the booming tech sector in West Loop. So, here we are, soaring rents, low interest rates, well developed retail and entertainment districts in place, a booming job market for millennials in Chicago's growing nearby tech sector, relatively low levels of home construction, and you get "The Hottest Neighborhood in America."


